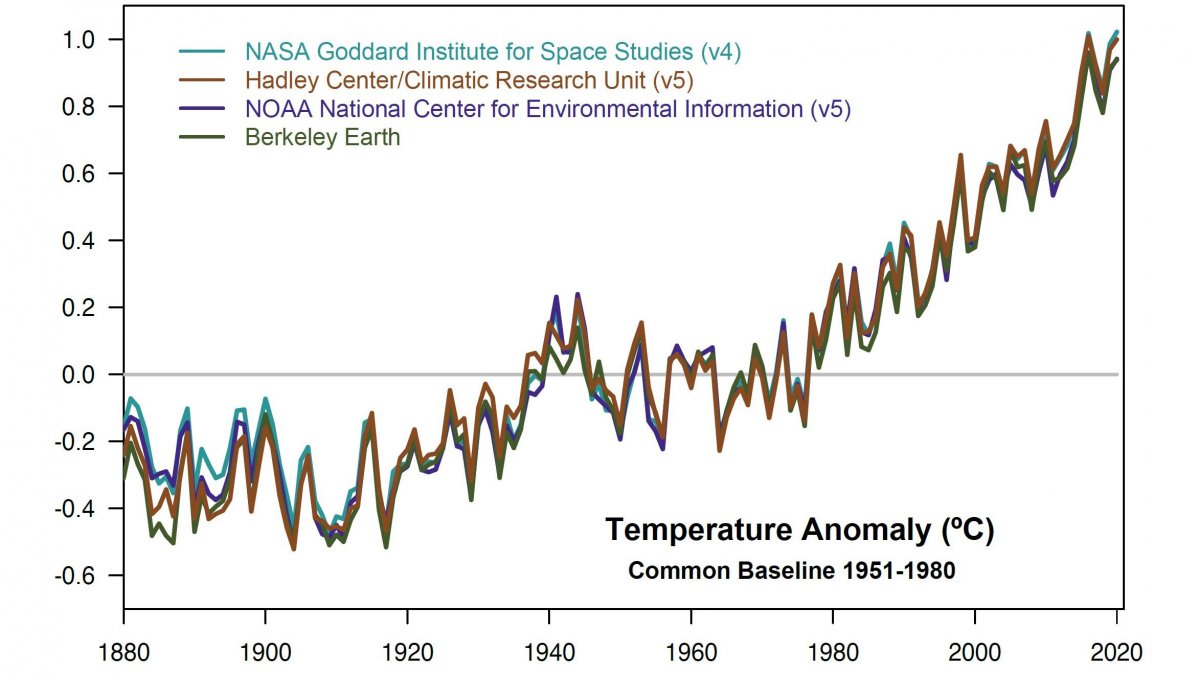
Seven warmest years: NASA sees continued dramatic warming trend
Source: Heise.de added 15th Jan 2021“The past seven years have been the warmest seven in history,” says Gavin Schmidt, director of NASA’s Goddard Institute for Space Studies (GISS). This characterizes the global sustained and dramatic warming trend.
The GISS has determined that the global average surface temperature in the past year together with 2016 was highest. The World Weather Organization (WMO) recently announced that 2020 was just behind 2016 the second warmest year in a century and a half. According to GISS, the average worldwide temperature 2020 was around 1, 02 ° C higher than the base value from 1951 to 1980. Since the late 19. In the 20th century, the average temperature of the earth had risen by 1.2 ° C.
Schmidt emphasizes that it is not important whether a year becomes a record holder or not, it is more important long-term trens. In view of the development so far, further records are to be expected.
Ice is melting The rising temperatures are melting the ice in the sea And the ice sheet mass is decreasing, the sea level is rising, there are longer and more intense heat waves and the habitats of animals and plants are shifting, explains NASA. Understanding such long-term trends is important for people to adapt by growing suitable crops, managing water reserves and preparing for extreme weather events.
In the first half of the year 2020 the Australian bushfires 46 burned millions of hectares of land and smoke and other particles 30 km high into the atmosphere. These blocked sunlight and so likely cooled the atmosphere slightly. On the other hand, restrictions related to the coronavirus pandemic would have helped the industry to emit fewer particles, allowing more sunlight to reach the surface of the earth. This has resulted in a small but potentially significant warming effect. Due to the shutdown of power plants and other emitters, less CO 2 was emitted, but the total CO 2 – concentration increased further.
El Niño The greatest cause of global temperature fluctuations is the El Niño Southern Oscillation (ENSO), a naturally occurring cycle of heat exchange between the ocean and the atmosphere. 2020 started in a cool ENSO phase and ended in a warm one. The cooling influence from the negative phase will probably have a greater influence on 2021 than on 2020 . 2016 a strong El Niño gave a significant heat boost.
The scientists of the US weather service NOAA, who at are involved in the evaluations of the WMO, use largely the same raw temperature data for their analysis, but with the years 1901 to 2000 a different starting period and a different methodology, explains NASA. Unlike NASA, NOAA does not derive temperatures in polar regions without observations; that makes up a large part of the difference between NASA and NOAA datasets.
NASA takes measurements from satellites as well as from 26. Weather stations and thousands of ship- and buoy-based observations, she explains. Uncertainties in the results are mainly due to the fact that the locations of weather stations and temperature measurement methods have changed over time.
(anw)
brands: Adapt Boost Century Extreme First longer One other POLAR Space Strong Value media: Heise.de keywords: NASA
Related posts
Notice: Undefined variable: all_related in /var/www/vhosts/rondea.com/httpdocs/wp-content/themes/rondea-2-0/single-article.php on line 88
Notice: Undefined variable: all_related in /var/www/vhosts/rondea.com/httpdocs/wp-content/themes/rondea-2-0/single-article.php on line 88
Related Products
Notice: Undefined variable: all_related in /var/www/vhosts/rondea.com/httpdocs/wp-content/themes/rondea-2-0/single-article.php on line 91
Warning: Invalid argument supplied for foreach() in /var/www/vhosts/rondea.com/httpdocs/wp-content/themes/rondea-2-0/single-article.php on line 91
